
- Colony Northstar shares fell sharply over the past 6 months due to poor operating results and an unclear strategy for improvement
- 1Q18 earnings are unlikely to hold any surprises. Healthcare peers have been weak, Industrial and Hospitality have been strong. “Unallocated” corporate costs are the biggest uncertainty.
- With little conviction I estimate $0.74/share of FFO for 2018 and a lowball $0.12/share target for 1Q.
- Permanent capital vehicle Northstar Realty Europe is delivering a strong shareholder return and Colony Northstar Credit may also do so.
- The corporate strategy has known unknowns. Clarity would be welcome, but cannot be forecast.
This article will try to summarize key points from my March “Merger Math” article, the many good comments posted on Seeking Alpha, and subsequent developments.

Topics:
- Review of Guidance and Forward-Looking Statements
- News since March 1
- Permanent Capital Vehicles NRE and CLNC
- The Known Unknowns
REVIEW OF GUIDANCE AND FORWARD-LOOKING STATEMENTS
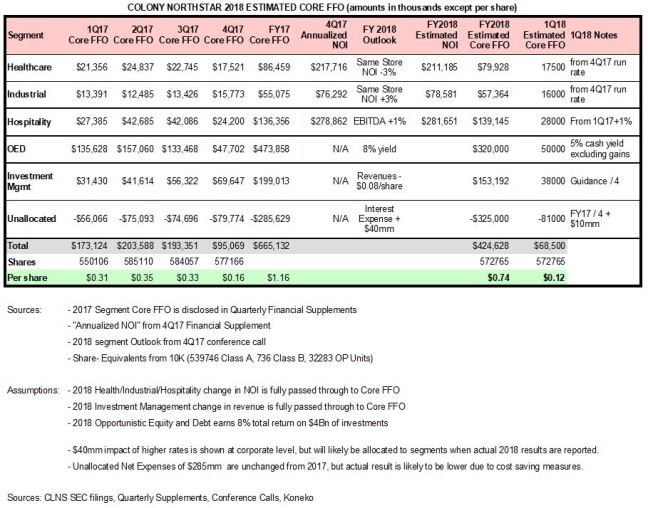
Colony provided several forward looking statements in its 4Q17 press release and conference call which the following table attempts to assemble into a forecast of 2018 FFO. The 1Q estimate is a conservative combination of the full year estimate and the 4Q17 run rate. Conviction in these forecasts as low, however the individual line items may provide helpful context for understanding the actual 1Q18 results when they are reported.
Background discussion of guidance and estimates:
- CLNS press release disclosed an estimate of “net cash flow, excluding gains” of $0.44/share for 2018. CLNS did not explain what was deducted to arrive at this “net” figure. The company did not explain the relationship between “net cash flow” and “Core FFO”. This estimate of $0.44 is precise, but may not be meaningful. Management may not refer to it again in explaining future results.
- Healthcare Same-Store Net Operating Income -3% in 2018 as “we expect industry conditions to remain challenging for healthcare and real estate particularly in the skilled nursing facility sector“. About 1/3 of segment NOI is from net-leased skilled nursing facilities, the weakest healthcare segment. CLNS 4Q supplemental report (page 19) shows CLNS share of Healthcare segment Annualized 2017 NOI was $218mm. If a 3% decline in NOI flows directly to “Core FFO” then that would imply $80mm Core FFO for FY18, or $20mm for 1Q. But dispositions could lead to a lower result. 4Q17 segment FFO was $17.5mm and the company suggested that the company-wide 4Q17 results were a “proxy for the kind of run rate going forward“. For comparison:
- Welltower results reaffirmed guidance of 2018 Same store NOI growth of 1.0%-2%.
- Ventas provided guidance for Same Store Cash NOI growth of 0.5%-1.5%
- HCP provided guidance of Same Property Portfolio Cash NOI growth of 0.25%-1.75%, including net leased senior housing growth of 0.5%-1.5%.
- Industrial Same-Store Net Operating Income +3% in 2018. CLNS 4Q supplemental report (page 22) shows CLNS share of Industrial segment Annualized 2017 NOI was $76mm. If a 3% increase in same store NOI flows directly to “Core FFO” then that would imply $57mm Core FFO for FY18, or $14mm for 1Q. Acquisitions could lead to a higher result. 4Q17 segment FFO was $16mm and the company suggested that the company-wide 4Q17 results were a “proxy for the kind of run rate going forward“. For comparison
- Rexford provided guidance for growth in Stabilized Same Property Portfolio NOI of 4.5%-6.0%.
- Prologis provided guidance for growth in “Cash Same Store NOI” of 5.5%-6.5%.
- Duke Realty guidance is for “same property NOI” growth of 3.25%-4.75%.
- Liberty Property guidance is for growth in “Same Store Operating Income – Cash” of 4.0-5.0%.
- DCT Industrial guidance prior to announcement of its acquisition by prologis was for Same Store Portfolio NOI Growth – Cash Basis of 4%-5%.
- First Industrial guidance is for growth in “Same Store NOI – Cash” of 4%-5%.
- Eastgroup guidance os for growth in Same Property NOI – Cash of 3.2%-4.2%.
- Hospitality REVPAR and EBITDA Growth +1% in 2018 “reflecting a conservative view on economic conditions”. CLNS 4Q supplemental report (page 24) shows CLNS share of 2017 Hospitality segment NOI was $279mm. If a 1% increase in EBITDA flows directly to “Core FFO” then that would imply $139mm Core FFO for FY18. Seasonality creates stronger results in 2Q/3Q and weaker in 1Q/4Q. 4Q17 segment FFO was $24mm and the company suggested that the company-wide 4Q17 results were a “proxy for the kind of run rate going forward“. For comparison:
- Host raised guidance for REVPAR growth to 1.5%-2.5%
- Park raised guidance for REVPAR growth to 0.5%-2.5%
- Apple provided guidance for REVPAR growth of 0%-2.0%
- Ryman maintained guidance for REVPAR growth of 2.0%-4.0%
- Sunstone slightly raised guidance for REVPAR growth to 0%-2.5%
- Opportunistic Equity & Debt run rate Core FFO yield of 8% off net book value of $4Bn. Quarterly results in this segment are likely to be uneven due to periodic recognition of gains. The company noted that “we’re expecting considerably less gains in 2018 versus 2017″. An 8% yield would imply an average of $80mm/quarter, but 4Q17 FFO was only $48mm. A 5% yield ($50mm/qtr) would be a conservative estimate of cash income from rents, interest, and dividends. Extra income from gains would boost returns to the target level, but could be recognized unevenly.
- Investment Management fee revenues diluted by $0.08/share. Frankly this was a weird way to provide guidance. It may have been an attempt to discretely disclose that segment revenues would decline by $46mm or 19%. If this flows directly to earnings then 2018 segment Core FFO would decline to $153mm or $38mm/qtr, but note that 2017 quarterly results were volatile.
- Corporate Interest Expense to increase by $0.07/share due to higher LIBOR. This implies $40mm of additional expense which will be allocated to the operating segments that use borrowed funds.
- Other. The company claims to have achieved G&A merger synergies of $150mm, but gave no outlook for the actual run-rate for unallocated corporate overhead which reported negative FFO of $286mm in 2017.
Peer results suggest that Industrial and Hotels may beat CLNS guidance. Hotels are benefiting from a strong economy and price inflation. The biggest uncertainty in the earnings estimate is the “Unallocated” segment.
NEWS SINCE MARCH 1
An asset manager cannot build a business on a promise to deliver consistently high returns, but it should be able to gain investor trust by reliably communicating and executing its strategy. Some CLNS segments get it:
- Colony Industrial – The business has published 4 recent press releases describing recent investments. These are not material corporate developments, but they demonstrate to current and potential co-investors that the business is successfully executing its strategy. The segment’s website has plenty of tangible facts about the business and is a great model for what the rest of CLNS should look like.
- Digital Colony – The business has published 1 recent press release describing a new investment.
- Colony S2K – acquisition of this retail distribution business closed on May 1. The purchase price has not been disclosed. Subsequent to year-end results the Northstar retail business closed closed its primary offering of Northstar/RXR after total sales of $41mm, less than the original target of $2.0Bn. CLNS CEO said the retail strategy was to acquire S2K and then let Steve Kantor figure out what to do. He seems to have the right concept:

- AccorInvest – This US$5Bn transaction has been disclosed by almost every participant except CLNS. At this time I believe it is unclear whether CLNS will simply be a minority equity investor or if it will also earn management fees. Disclosure of the transaction might provide evidence to CLNS investors that the company is successfully executing its strategy, whatever that is.
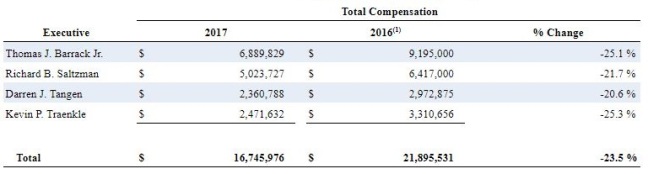
- Management Compensation – CLNS proxy statement disclosed that senior executive compensation declined by 23.5% in 2017. Management missed the minimum FFO target, passed the fundraising target, and reached 85% of “Individual Goals & Objectives”. Target incentive compensation was reduced by 10% for 2018.
PERMANENT CAPITAL VEHICLES NRE AND CLNC
CLNS listed business units provide highly predictable long-term fee revenues and visibility into the value of CLNS ownership interest. It would not make sense for CLNS to trade at NAV (equity value per share) while these units trade at a discount. But if these units appreciate to trade close to their own NAVs then it would no longer make sense for CLNS to trade at a large discount.
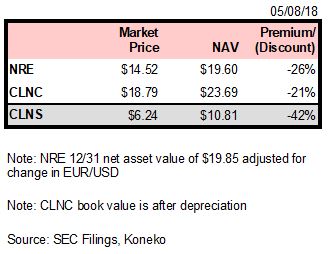
NRE posted excellent 4Q17 results (press release, presentation, and conference call), but has not yet filed 1Q18. Most impressive was the increase in Net Asset Value from $15.88 at 12/31/16 to $19.85 at 12/31/17 which the company attributed to higher rates achieved on new leases.
CLNC posted satisfactory 1Q18 results (press release and supplemental). Initial reaction:
- Core earnings of $0.44/share already covers the current dividend rate. An increase is highly likely in 2018
- Clear strategy of increasing utilization of existing borrowing facilities to optimize leverage and increase earnings
- Book value of $23.69 includes the impact of depreciation of owned real estate. Like STWD and LADR this depreciation is probably non-economic and should be backed out in estimation of “fair value”. Undepreciated book value was not disclosed, but is probably $0.15 higher
- $30mm of transaction costs in 1Q18 is likely due to the merger and listing so non-recurring
- The income statement includes 3 months of earnings from the assets contributed by CLNS and 2 post-merger months of earnings from the assets of the Northstar REITs. Weighted average share count combines three months of shares held by CLNS with 2 post-merger months of shares issued to the Northstar REIT investors. The partial period for earnings and partial period for shares outstanding match so the reported $0.44 of core earnings seems to be a reasonable run rate.
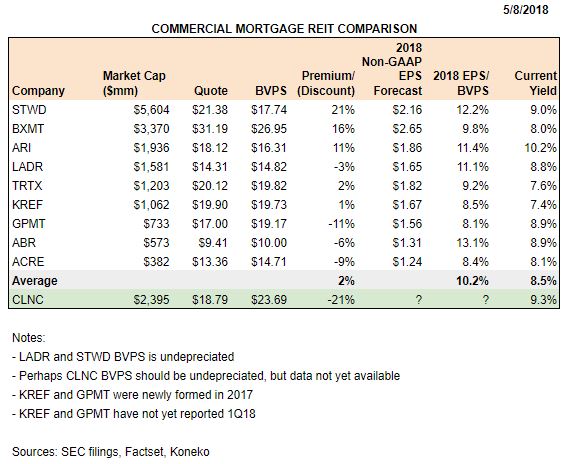
- CLNC is clearly undervalued relative to comps, especially the large cap peers STWD BXMT and ARI.
THE KNOWN UNKNOWNS
When the numbers are good investors may not pay much attention to what a company is doing. When the numbers are bad, as they have been at CLNS, investors look for tangible value and a rational strategy for improvement. CLNS has not yet demonstrated either.
When the three-way merger was announced Colony CEO Richard Saltzman said it was too early to tell what the company’s main businesses would be (transcript 06/03/16):
Two years later management still can’t clearly answer that question. On March 1 CEO Richard Saltzman said:
I interpreted these comments to mean that Healthcare and Hospitality (over 50% of the company’s assets) were deemed non-core lines of business that the company would try to sell. Some people disagreed and argued that “de-emphasis” just meant selective sales of individual underperforming assets. It’s not clear.
The company’s value is confusing due to the history of corporate transactions and reluctance of CLNS management to provide clear guidance. The segment reporting is unclear due to overlapping definitions. Is investment management a vertical? Or should it be a horizontal within each vertical? Is Europe a “Vertical”? Or a “Horizontal” present in every “Vertical”? Or a “Space” with its own Verticals and Horizontals? Co-investment in the business units could provide third-party validation of how much these segments are worth. Formation of CLNC has done that with a portion of the “Opportunistic Equity and Debt” assets, but there’s no apparent progress and perhaps no plan for Health and Hotels.
Disclosures:
The author is a shareholder of CLNS CLNC NRE and LADR. The author does not make any recommendation regarding any investment in any company mentioned in this article. Investors are encouraged to check all of the key facts cited here from SEC filings prior to making their own investment decisions.

Hi,
Really enjoy the blog
I’m still thinking through, but I think Clnc core eps is a bit misleading- they use weighted average share number for it. On a run rate using current share count it was probably in the low $0.30, not 0.44. That said, I don’t believe it includes the first month of earnings pre merger. All in, I agree with you that clnc is way undervalued and on track, just wanted to swap thoughts on that piece
Sent from my iPhone
LikeLike
Thanks! Great point. I will check the supplemental and clarify this point in the article.
LikeLike
As you stated, earnings include 3 months of contributed CLNS assets, but only 2 post-merger months of Northstar REITs. And share count is a 101mm weighted average reflecting 3 months of shares held by CLNS but only 2 post-merger months of shares distributed to Northstar REIT investors. The partial period earnings and partial period shares match so the bottom line Core FFO of $0.44 may be reasonable.
“For the period ending March 31, 2018, the following financial statements represents only the pre-merger financial
information of the Colony NorthStar Investment Entities, as the accounting acquirer, on a stand-alone basis from
January 1, 2018 through January 31, 2018 and the results of operations of Colony NorthStar Credit following January
31, 2018. As a result, the reported first quarter financial results are not representative of a full quarter of operating
earnings since they do not include financial results of NorthStar I and NorthStar II from January 1, 2018 through
January 31, 2018.”
“For Core Earnings per share, the Company assumes the 44.4 million shares of Class B-3 common stock and the 3.1 million OP units (held by members other than the
Company or its subsidiaries) were outstanding from January 1, 2018 through January 31, 2018 to reflect the standalone pre-merger financial information of the
accounting acquirer. Following January 31, 2018, the Company assumes approximately 131.0 million of shares of class A common stock, class B-3 common stock and
OP units (held by members other than the Company or its subsidiaries) were outstanding. This assumes that the weighted average share count for the period was
approximately 101.7 million shares”
LikeLike
Hi John and thank you for your commentary. I cannot get an answer from CLNC on something I believe was a possible unethical accounting trick played on NRE1 and NRE2 investors. The NAV of $25 declined to $23.69 partly due to shares given to the new board as you alluded to in a previous SA article. However this additional decline below $24 was concerning. I asked investor relations what caused this an the answer was a write down of private equity. I asked which portfolio this came from and I can only assume it was from the assets CLNS contributed. My fear is that they had these troubled assets on their books that needed to be devalued so they dumped them into CLNC then shared the losses with the retail investors. It would have been a very convenient dumping ground and keep losses off the books of the parent company CLNS. I’d like to get your take on this please.
LikeLike
Any thoughts about the CLNS preferred issues?
LikeLike
Hi Nick,
I updated NRE today and I will review CLNC next. It looks like NAV is after accumulated depreciation of about $0.11 on land and buildings. That is probably non-economic and can be added back (as analysts do for STWD and LADR). That would put NAV at $23.80.
CLNS reported a gain on its contribution of assets to CLNC. I think it’s more likely that the assets already held by NRE1 and NRE2 were responsible for any write-downs. Northstar purchased risky assets in order to try to cover high fees and promises of high dividends. I’ll review in more detail and probably publish something next week.
LikeLike